
 |
"Lean" is a practice that considers the effort & cost of resources for any task, other than those that create value for the customer, to be wasteful. Those tasks are targets for elimination. While Lean principles originated in the manufacturing industry, all industries have adopted Lean to make the effort needed to complete production goals more efficient.
Here are two Lean tools which can be useful to a manager for the prioritization of project tasks, and for root cause analysis when issues arise. |
PICK Chart
When faced with multiple tasks, a PICK chart may be used to determine the most useful or important. Originally developed by Lockheed Martin, a PICK chart organizes tasks or ideas into 1 of 4 categories. The acronym PICK identifies those categories as Possible, Implement, Challenge and Kill.
A PICK chart is set up as a grid, two squares high and two squares across. The PICK acronym comes from the labels for each quadrant of the grid:
- Possible - tasks that are easy to implement but have a low payoff.
- Implement - tasks that are easy to implement and a high payoff.
- Challenge - tasks that are hard to implement and a high payoff.
- Kill - tasks that are hard to implement and have low payoff.
Low Payoff
|
High Payoff
|
|
Easy to do
|
Possible
|
Implement
|
Hard to do
|
Kill
|
Challenge
|
Once each idea from a brainstorming session has been placed on the most appropriate square, it becomes easier to identify which ideas should be acted on first. In a group setting, PICK charts are useful for focusing a discussion and achieving consensus.
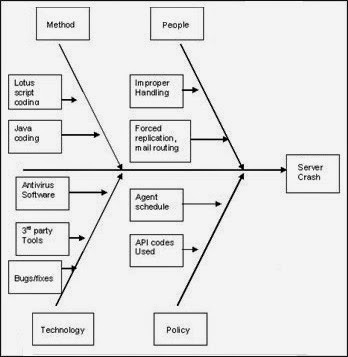
Fishbone Diagram
A fishbone diagram, also called a cause and effect diagram, is a tool for categorizing the potential causes of a problem in order to identify its root causes. The design of the diagram looks much like a skeleton of a fish. It has a head (which states the problem), a backbone (connects the head to the ribs), and it has ribs (which categorizes the causes). Hence, the name: Fishbone.
This is useful in brainstorming sessions to focus the conversation. Fishbone diagrams are typically worked right to left, with each large "bone" of the fish branching out to include smaller bones containing more detail. After the group has brainstormed all the possible causes for a problem, the manager will lead the group to rate the potential causes according to their level of importance and likeliness.
|
 |
Lean aims to make work processes simple enough to understand, do and manage. These tools are easy to document and apply in your workplace.
David Schuchman
No comments:
Post a Comment
I encourage you to add your comment to this post...